
We want people to use alternative fuel options, but we aren’t giving them the resources with which to do it. I love the outdoors, I want to enjoy it, and I want to preserve it. But it’s hard to do that in an electric vehicle without a LOT of planning; in general, it’s inaccessible, and I’ll show you why.
In July of 2020, my best friend & I drove her Tesla from San Francisco to Washington, DC. She moved back home to her parents’ place during COVID and needed to safely & quickly get her vehicle across the country. We decided that we’d stay at campgrounds for the whole trip to keep costs down, minimize social interaction (avoiding COVID), minimize the environmental footprint of the trip, and to maximize our sightseeing. We both love the outdoors, hiking, camping, and the National Parks. We try to be environmentally-minded in many aspects of our life, including using alternative fuel options (hence the Tesla) and enjoying the outdoors (hence the camping). What we didn’t realize is that finding and accessing electric vehicle chargers would be what our next two weeks would solely revolve around.
Most outdoor recreation areas (parks, trails, campgrounds, etc.) tend to be located in more rural or less-densely populated areas. That is not surprising; what is surprising is how few & far between electric vehicle chargers, and alternative fuel options in general, are when you find yourself in these areas. It would make sense that the theoretical Venn diagram of people who are environmentally-minded about their fuel choices and people that enjoy the outdoors has quite a bit of overlap. And yet, this demographic is not provided with the adequate resources to do so. Even aside from those that wish to use the outdoor recreation areas, the populations of the surrounding areas (rural towns; tend to be lower-income), are also not able to own electric vehicles due to the inaccessibility of charging stations. Making electric vehicle chargers more accessible to these demographics would help a wider range of people select alternative fuel options long-term that may be less harmful to the environment.
I wanted my project to highlight the geographic disparity here and provide a visual on the inaccessibility of EV chargers in rural and natural areas. I was able to find data on multiple U.S. states, but had to scale this down to just two states during the process of data prep and to keep the project on the more manageable & user-friendly side. I focused on Michigan and Massachusetts as my case studies for this project.
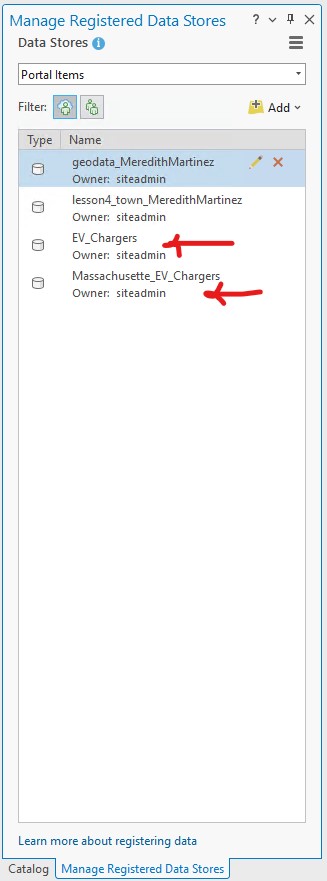
I started off by gathering data from various states’ Open GIS Data Portals online, available to the public. Both Michigan and Massachusetts have a robust and thorough offering of GIS data on their portals, and make it easy for users to download these in workable files (.shp, .kml, .csv, gdb.zip, etc.). The Massachusetts Department of Transportation has a very recently updated dataset of the state’s electric vehicle charging stations, and the Massachusetts Bureau of Geographic Information (MassGIS) has an updated dataset of the state’s recreational spaces and the trail networks, all of which I used for the project. Michigan Open GIS Data is always a great resource, and is where I found all four datasets that I used on the state’s electric vehicle chargers, State Park boundaries, campgrounds, and trails. I downloaded all of these datasets and imported them into ArcGIS Pro. After data prep and symbology in ArcGIS Pro, I used the instructions from Lesson 3 to move all of the data into an ArcSDE geodatabase in SQL Server Express (Figure 1) so that I could allow the user to edit the data – if new electric vehicle stations are built over time, my web map/app could still stay updated and relevant.
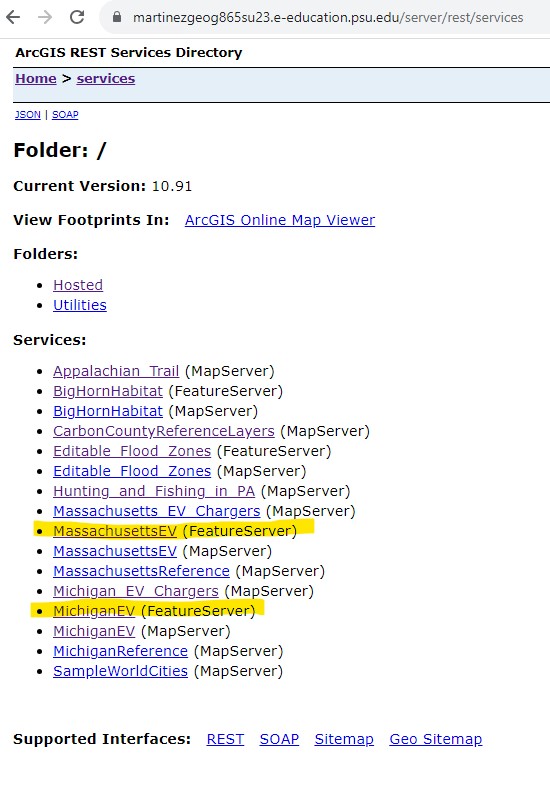
I separated my data out into reference layers (campgrounds, park boundaries, trails) and editable layers (EV chargers), and I was able to successfully serve my editable layers as FeatureServers on my ArcGIS REST Server (Figure 2), along with serving my reference layers as regular MapServers so they could be layers in my web map.
Once my data was on the server, I began working with Javascript (Figure 3), HTML (Figure 4), and CSS (Figure 5) to create a customized, interactive web map using the data.


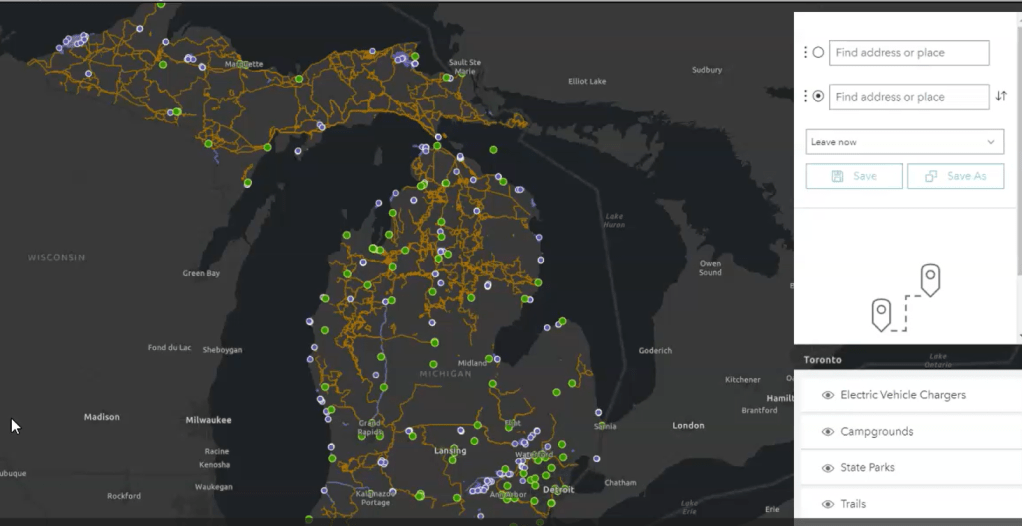
Using the ArcGIS API for Javascript, I was able to make a site that showed both maps (one of Michigan and one of Massachusetts), one on top of another, with helpful pop-ups enabled and widgets around them that allowed the user to interact with the data in ways that are relevant, including directions, layer list, legend, and zoom (Figure 6 and Figure 7).
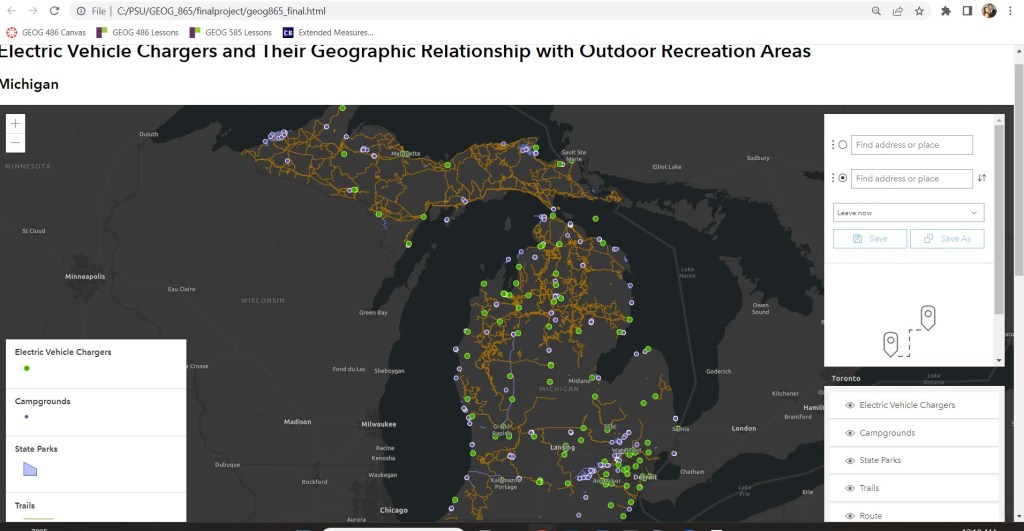
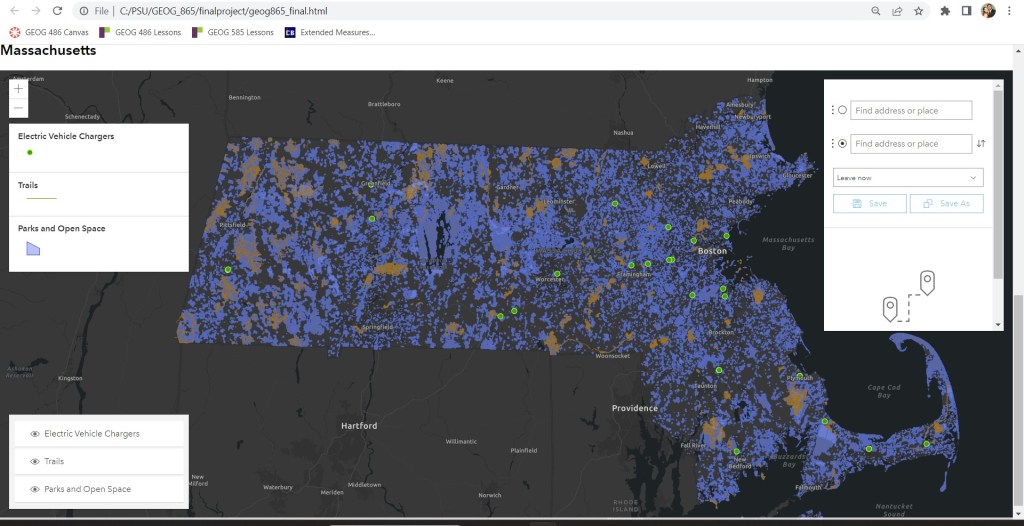
I wanted to be sure to include the directions widget to allow the user to pinpoint an outdoor recreation area and it’s nearest EV charger and be able to quickly see how far of a drive it would be between the two. I hadn’t worked with directionsWidget before, so it was fun experimenting with routeLayers for the first time. It took some time, but I got it to where I was content with the functionality of the web page. I also went ahead and used the same data from my server to create an Experience app in ArcGIS Online (using Experience Builder). I uploaded the data to my ArcGIS Online account using the add-by-url feature to grab them straight from the server. In Experience Builder, I set the two web maps side-by-side, surrounded by their corresponding widgets as described above (Figure 8).

Sources:
The Massachusetts Department of Transportation (MassDoT)

Leave a comment