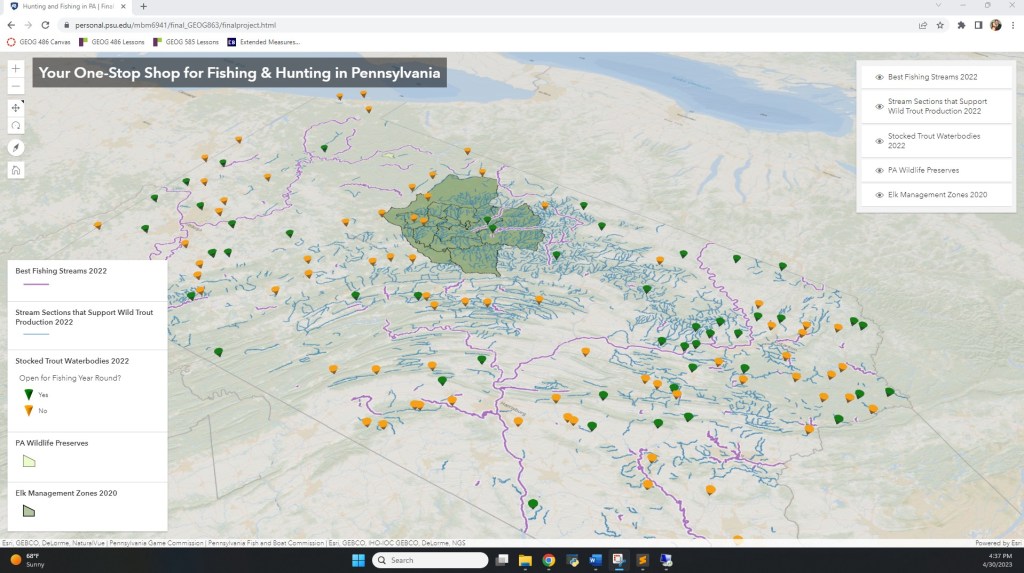
I created a “one-stop shop” interactive web app for someone interested in ecologically-conscious fishing & hunting in the state of Pennsylvania. I created my own instance of ArcGIS Server, found, extracted, prepped, and published data on that instance, and then developed the web app using JavaScript, ArcGIS API for JavaScript, HTML, CSS, and the data on my server. See my full .js script below.
//Meredith Martinez
//// Created my own instance of ArcGIS Server, found, extracted, prepped, & published data on that
////  instance, and then developed the following app utilizing the data on my server.

//import necessary modules/methods from esri
require([
	"esri/Map",
	"esri/views/SceneView",
	"esri/Camera",
	"esri/symbols/PointSymbol3D",
	"esri/symbols/ObjectSymbol3DLayer",
	"esri/symbols/LineSymbol3D",
	"esri/symbols/LineSymbol3DLayer",
	"esri/symbols/PolygonSymbol3D",
	"esri/symbols/FillSymbol3DLayer",
	"esri/layers/FeatureLayer",
	"esri/renderers/UniqueValueRenderer",
	"esri/renderers/SimpleRenderer",
	"esri/widgets/Legend",
	"esri/widgets/LayerList",
	"esri/widgets/Home",
], (Map, SceneView, Camera, PointSymbol3D, ObjectSymbol3DLayer, LineSymbol3D, LineSymbol3DLayer, PolygonSymbol3D, FillSymbol3DLayer, FeatureLayer, UniqueValueRenderer, SimpleRenderer, Legend, LayerList, Home) => {

 //Since each layer has different names for their fields, and I want to make each pop-up, renderer, and utlimate symbology unique for each layer, I organized my code by layer.
 ////Also to keep me on track and prevent mistakes, since there are a lot of working layers here.

// Layer 0 - Stocked Trout Waterbodies 2022 - Start

//// create and set properties for the pop-up template, and place in a variable for later use
	const layer0template = {
			title: "Stocked Trout Waterbody/Stream - {GNIS_NAME}",
			content: "County: {County}<br />Region: {Region}<br />Year Round? {Year_Round}<br /> Early Open? {Early_Open}<br />Trout fishing encouraged during open season."
		};

//// create a UniqueValueRenderer for the Y/N values in the Year Round field, to make it easy for the user to distinguish which areas are open year-round or not
	const yearroundRenderer = new UniqueValueRenderer({
		field: "Year_Round",
		legendOptions: {
			title: "Open for Fishing Year Round?"
		}
	});

//// create function for the UniqueValueRenderer that creates the 3D Symbols as it goes, but also assigns different colors to each (Y or N) value
	const addClass = function(val, renderer) {
		var lbl, sym;
		if(val == "Y") {
			lbl = "Yes";
			sym = new PointSymbol3D({
				symbolLayers: [
					new ObjectSymbol3DLayer({
						material: { color: "green" },
						resource: { primitive: "inverted-cone" },
						height: 5000,
						width: 5000
					})
				]
			});
		} else {
			lbl = "No";
			sym = new PointSymbol3D({
				symbolLayers: [
					new ObjectSymbol3DLayer({
						material: { color: "orange" },
						resource: { primitive: "inverted-cone" },
						height: 5000,
						width: 5000
					})
				]
			})
		}
		renderer.addUniqueValueInfo({
			value: val,
			symbol: sym,
			label: lbl
		});
	}

	addClass("Y", yearroundRenderer);
	addClass("N", yearroundRenderer);

//// create a FeatureLayer for the data from Layer 0, assign the appropriate pop-up template and renderer, and set a user-friendly title for the layer
	const layer0 = new FeatureLayer({
    	url: "https://martinezgeog865su23.e-education.psu.edu/server/rest/services/Hunting_and_Fishing_in_PA/MapServer/0",
    	popupTemplate: layer0template,
    	renderer: yearroundRenderer,
    	title: "Stocked Trout Waterbodies 2022"
	});

// Layer 0 - Stocked Trout Waterbodies 2022 - End

// Layer 1 - Stream Sections that Support Wild Trout Production 2022 - Start

//// create and set properties for the pop-up template, and place in a variable for later use
	const layer1template = {
		title: "Stream Supporting Wild Trout Production - {WtrName}",
		content: "County: {County}<br />Tributary: {Trib}<br />Limits: {Limits}"
	};

//// set the properties for the layer's 3D symbols and place them in a variable for later use
	const layer1Sym = new LineSymbol3D({
		symbolLayers: [
			new LineSymbol3DLayer({
				material: {
					color: [57, 138, 191, 0.7], //make the features a bit transparent since there's a lot going on in the map view
				},
				size: 1.3
			})
		]
	});

//// use a SimpleRenderer and the created symbol variable to assign the symbology to the layer's features
	const layer1Renderer = new SimpleRenderer({
		symbol: layer1Sym
	});

//// create a FeatureLayer for the data, assign the appropriate pop-up template and renderer, set a user-friendly title for the layer, and set the elevationInfo so the features have a draped appearance
	const layer1 = new FeatureLayer({
		url: "https://martinezgeog865su23.e-education.psu.edu/server/rest/services/Hunting_and_Fishing_in_PA/MapServer/1",
		popupTemplate: layer1template,
		renderer: layer1Renderer,
		title: "Stream Sections that Support Wild Trout Production 2022",
		elevationInfo: {
			mode: "on-the-ground"
		}
	});

// Layer 1 - Stream Sections that Support Wild Trout Production 2022 - End

// Layer 2 - Best Fishing Streams 2022 - Start

//// create and set properties for the pop-up template, and place in a variable for later use
	const layer2template = {
		title: "Best Fishing Streams 2022 - {WtrName}",
		content: "County: {County}<br />Upper Limit: {SecUpper_1}<br />Lower Limit: {SecLower_1}<br />Fishing encouraged during open season."
	};

//// set the properties for the layer's 3D symbols and place them in a variable for later use
	const layer2Sym = new LineSymbol3D({
		symbolLayers: [
			new LineSymbol3DLayer({
				material: {
					color: "white",
				},
				size: 5, // I wanted these features to have an outline, but they are already a line - so I used symbolLayers to my advantage and made a slightly wider, white line to go behind the intended feature line and act as an outline
			}),
			new LineSymbol3DLayer({
				material: {
					color: "#b475c7",
				},
				size: 2,
			})
		]
	});

//// use a SimpleRenderer and the created symbol variable to assign the symbology to the layer's features
	const layer2Renderer = new SimpleRenderer({
		symbol: layer2Sym
	});

//// create a FeatureLayer for the data, assign the appropriate pop-up template and renderer, set a user-friendly title for the layer, and set the elevationInfo so the features have a draped appearance
	const layer2 = new FeatureLayer({
		url: "https://martinezgeog865su23.e-education.psu.edu/server/rest/services/Hunting_and_Fishing_in_PA/MapServer/2",
		popupTemplate: layer2template,
		renderer: layer2Renderer,
		title: "Best Fishing Streams 2022",
		elevationInfo: {
			mode: "on-the-ground"
		}
	});

// Layer 2 - Best Fishing Streams 2022 - End

// I decided not to use Layer 3, things started getting a little too hectic in the map and something had to go. Although that layer is still in the ArcGIS Server and could be used easily.

// Layer 4 - Wildlife Preserves - Start

//// create and set properties for the pop-up template, and place in a variable for later use
	const layer4template = {
		title: "Wildlife Preserve - {NAME12}",
		content: "Name: {NAME12}<br />Acres: {CAL_ACRE}<br />Not permitted to fish or hunt in Wildlife Preserves."
	};

//// create a FeatureLayer for the data, assign the appropriate pop-up template, and set a user-friendly title for the layer
	const layer4 = new FeatureLayer({
		url: "https://martinezgeog865su23.e-education.psu.edu/server/rest/services/Hunting_and_Fishing_in_PA/MapServer/4",
		popupTemplate: layer4template,
		title: "PA Wildlife Preserves",
	});

// Layer 4 - Wildlife Preserves - End

// Layer 5 - Elk Management Zones 2020 - Start

//// create and set properties for the pop-up template, and place in a variable for later use
	const layer5template = {
		title: "Elk Management - {ZONE_NAME}",
		content: "Name: {SUBPOPULAT}<br />{ZONE_NAME}<br />Elk hunting encouraged during open season."
	};

//// set the properties for the layer's 3D symbols and place them in a variable for later use
	layer5Sym = new PolygonSymbol3D({
		symbolLayers: [
			new FillSymbol3DLayer({
				material: {
					color: [102, 143, 64, 0.5],
				},
				outline: {
					color: "black",
					size: 1
				}
			})
		]
	});

//// use a SimpleRenderer and the created symbol variable to assign the symbology to the layer's features
	const layer5Renderer = new SimpleRenderer({
		symbol: layer5Sym
	});

//// create a FeatureLayer for the data, assign the appropriate pop-up template and renderer, set a user-friendly title for the layer, and set the elevationInfo so the features have a draped appearance
	const layer5 = new FeatureLayer({
		url: "https://martinezgeog865su23.e-education.psu.edu/server/rest/services/Hunting_and_Fishing_in_PA/MapServer/5",
		popupTemplate: layer5template,
		title: "Elk Management Zones 2020",
		renderer: layer5Renderer,
		elevationInfo: {
			mode: "on-the-ground"
		}

	});

// Layer 5 - Elk Management Zones 2020 - End

//create the map object, set the desired basemap, and add the layers to the map
	const map = new Map({
		basemap: "oceans",
		layers: [layer5, layer4, layer0, layer1, layer2]
	});

// create a 3D view and set the desired default view using the camera property
	const view = new SceneView({
		container: "viewDiv",
		map: map,
		camera: new Camera({
			position: [-74.5, 37.5, 440000],
			heading: 328,
			tilt: 45
		})
	});

// create a Legend widget for the map to help the user distinguish between the symbologies
	const legend = new Legend({
	    view: view,
  });

// add the legend to the bottom left corner
  view.ui.add(legend, "bottom-left");

// create a LayerList widget to the map to allow the user to toggle the layers on and off
  const layerList = new LayerList({
  	view: view
  });

// add the LayerList to the top right corner
  view.ui.add(layerList, {position: "top-right"});

// create a Home widget for the map so the user can easily get back to the default view
  const homeWidget = new Home({
  	view: view
  });

 // add the Home widget to the top left corner
  view.ui.add(homeWidget, "top-left");

});
Leave a comment